SCHD Dividend Calculator: Track Your Dividend Snowball Growth
The SCHD Dividend Calculator helps you visualize how your investments in the Schwab U.S. Dividend Equity ETF (SCHD) can grow over time through dividend reinvestment. SCHD has delivered impressive performance with a 10-year dividend CAGR of around 11.13% and a 7.85% annual share price growth rate. Use this tool to understand the dividend snowball effect, where your reinvested dividends generate even more income — turning steady returns into long-term wealth.
Total Portfolio Value
Total Dividends Earned
Annual Dividend Income
Yield on Cost
Portfolio Value Growth
Dividend Income Over Time
| Year | Start Balance | Dividends Earned | Extra Investment | End Balance | Shares Owned |
|---|
Compare Scenarios
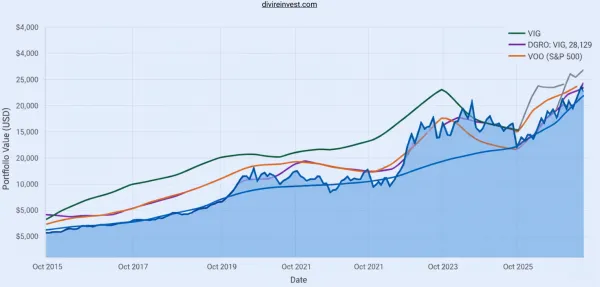
Compare SCHD with Other Stocks or ETFs
SCHD is a well-known dividend ETF, but there are many other options to explore, such as JEPI, JEPQ, DGRW, VOO, SPY, VTI, VTG, and more. With our stock comparison tool, you can easily check how two ETFs or stocks perform side by side. Simply enter the ticker symbols below to compare and research your favorite investments.
Why SCHD is So Popular
SCHD is a widely recognized dividend ETF, loved by many investors. A quick look at discussions on the /r/Dividends subreddit shows just how popular it is!
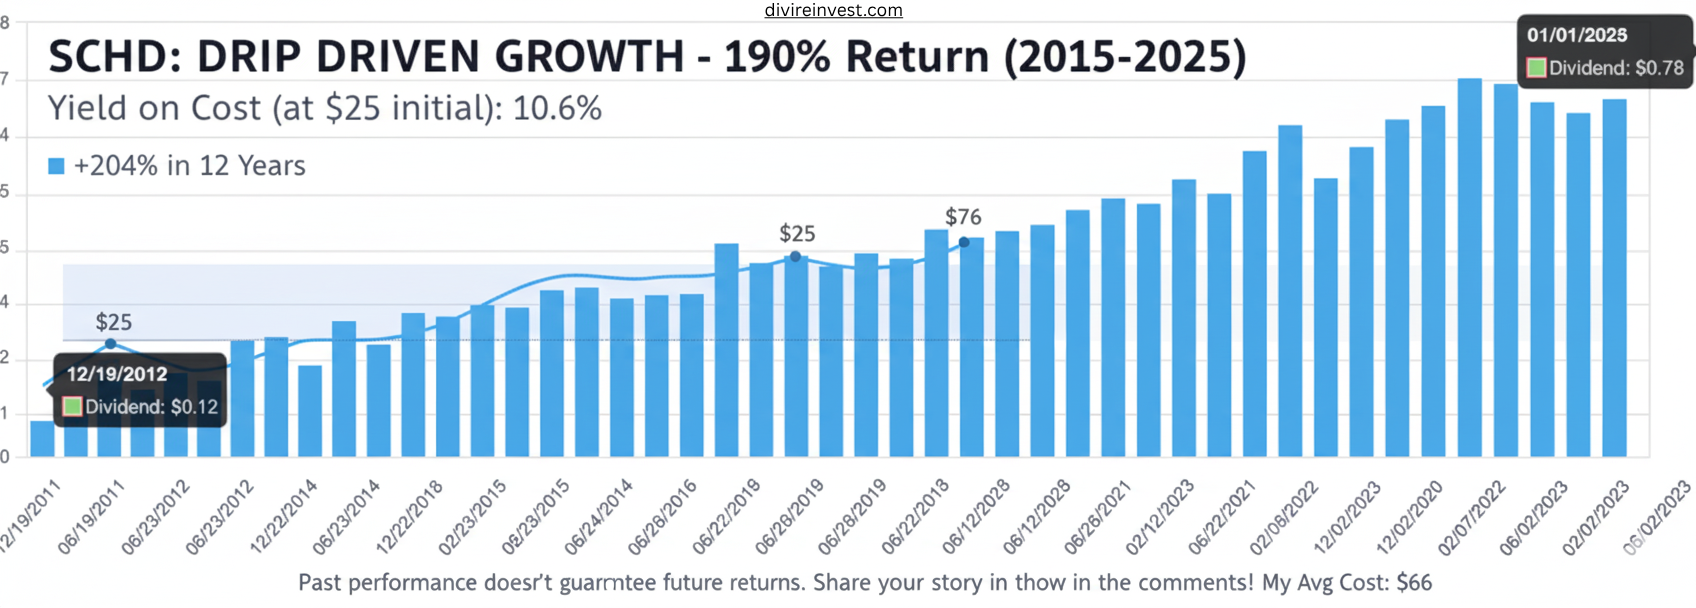
The main reason for SCHD’s popularity is its impressive track record of dividend growth and price appreciation, averaging over 10% per year across its 12-year history. Using a SCHD Dividend Calculator, you can estimate how your dividends can grow over time and see the power of the dividend snowball effect. Check out the chart below to see SCHD’s dividend growth and yield over the past 10 years.
Over the last 10 years (Jan 2015 to Jan 2025), SCHD has grown a lot if you reinvested your dividends using SCHD Dividend Calculator
If you had invested $10,000 in SCHD several years ago and reinvested all your dividends, your investment could now be worth nearly $29,000 — that’s around 190% total growth.
Without reinvesting, it might have grown to about $25,900 (a 159% gain), which clearly shows how powerful the SCHD Dividend Calculator concept of reinvestment can be over time.
💬 Do you invest in SCHD? Share in the comments when you started and what your average cost per share is — mine’s around $66!
Since launching in 2011, SCHD’s share price has increased from $25 to nearly $76 as of January 2025 — a 200% gain in 12 years. With our SCHD Dividend Calculator, you can explore your yield on cost, compounding growth, and future income potential.
To estimate how your dividends might grow with reinvestment, try our Dividend Reinvestment Calculator — it helps visualize how reinvesting dividends boosts long-term returns.
For example, if you purchased SCHD at $25, your yield on cost today would be about 10.6%, based on an annual dividend of $2.65. That’s the power of dividend growth and reinvestment working together.
Remember, past performance doesn’t guarantee future returns, but SCHD has historically matched or even outperformed the S&P 500.
SCHD Dividend Calculator & Reinvestment Snowball Effect
Many investors look at SCHD ETF’s dividend yield and wonder how some people end up earning double-digit returns. In reality, SCHD’s current yield is about 3.5%, not 10%. Using the SCHD Dividend Calculator, you can see how reinvested dividends can significantly boost your returns over time.
The difference comes from dividend growth and the power of What Is a DRIP Investment, How It Works reinvesting dividends (DRIP) over time. As the saying goes, “It’s not about timing the market, but about time in the market.” The longer you stay invested and reinvest your dividends, the more your returns compound — building what’s often called the dividend snowball effect.
Let’s look at two simple examples — one with dividend reinvestment and one without.
If you invest $10,000 in SCHD and add $100 per month, assuming an average 7.67% annual price growth and 11.54% annual dividend growth, here’s what your portfolio could look like after 20 years:
💧 With DRIP (Reinvesting Dividends):
- Portfolio Value: $239,621 → a 605% total return
- Annual Dividend: $17,403
- Yield on Cost: 51.19%
🚫 Without DRIP (No Reinvestment):
- Portfolio Value: $147,258 → a 333% total return
That’s an 81% higher total return simply by reinvesting dividends and letting compounding work in your favor. You can experiment with your own numbers using our SCHD Dividend Calculator.
By year 13, your total dividends nearly match your total investment — around $25,000. By year 17, your annual dividend income equals your initial investment. By year 20, your total dividends earned are nearly three times your total contributions.
After 25 years, your annual dividend income surpasses your total invested amount — $46,141 per year from $40,000 invested. Over that period, you would have collected $261,392 in dividends and achieved a 115% yield on cost.
By year 30, the compounding becomes even more impressive: $130,990 annual dividend income, $709,380 total dividends received, and a portfolio value of $1.29 million.
Patience, consistency, and reinvestment are what turn a modest yield into long-term wealth — the same principles illustrated in our SCHD Dividend Calculator. For official SCHD ETF details, visit the SCHD ETF Official Fund Page Charles Schwab SCHD ETF page.
Disclaimer: This information is for educational and informational purposes only and should not be considered financial advice.
SCHD vs VYM Dividend Growth Comparison
When comparing SCHD (Schwab U.S. Dividend Equity ETF) and VYM (Vanguard High Dividend Yield ETF), the difference lies in their dividend growth and long-term compounding.
Over the last decade, SCHD has shown stronger dividend growth, averaging over 10–12% per year, while VYM’s growth rate has been around 6–7%.
This means SCHD not only pays consistent dividends but also increases them faster — a major advantage for long-term investors using the SCHD Dividend Calculator to project future income.
VYM, on the other hand, focuses more on high-yield stability with less emphasis on growth. If your goal is steady income today, VYM can work. But if you want to build a dividend snowball that compounds over time, SCHD has historically been the better choice.
💡 Quick Insight:
If both ETFs start with a $10,000 investment, SCHD’s reinvested dividends could grow to nearly $29,000 in 10 years, while VYM might reach around $24,000 — showing the power of dividend reinvestment in SCHD.
FAQs
1. What is the SCHD Dividend Snowball Calculator?
The SCHD Dividend Calculator Snowball Calculator helps you estimate how your investments in the Schwab U.S. Dividend Equity ETF (SCHD) can grow over time through dividend reinvestment and compound returns. It shows how dividends can build a snowball effect, where your earnings generate more earnings.
2. How does the dividend snowball effect work with SCHD?
The dividend snowball effect happens when you reinvest your SCHD dividends to buy more shares. Over time, those new shares pay more dividends, creating a cycle of compounding growth that helps your investment grow faster.
3. What is the dividend growth rate of SCHD?
SCHD has shown a strong 10-year dividend CAGR (Compound Annual Growth Rate) of around 11.13%, along with about 7.85% annual price appreciation — making it one of the top-performing dividend ETFs in the U.S.
4. Can I use this calculator for other dividend ETFs?
Yes, while this tool focuses on SCHD, you can also use it to estimate dividend reinvestment and compound growth for other dividend ETFs or individual dividend stocks. Just adjust the values like dividend yield and growth rate.
5. Is SCHD a good ETF for long-term dividend investors?
Many investors consider SCHD one of the best long-term dividend growth ETFs due to its consistent performance, solid dividend history, and strong underlying companies. Reinvesting dividends in SCHD can help build long-term wealth.